
Talking with the seminar group over the weekend, the question of dominant values came up. We had no problems accepting the idea that people who came of age during the Great Depression came to place a high value on financial security. But it was a bit different when considering people who came of age in the 1950s, a time of conformity. Schewe and Meredith say that this generation came to value independence and rebellion. But what about the many people in that generation who still toe the line?
We used the bell curve to explore the spread of values throughout a generational cohort. A minority push the boundaries of new thought and behaviour. Another minority attempt to live out the values of previous generations. And in the middle are the people who gradually adopt and adapt emerging generational values.
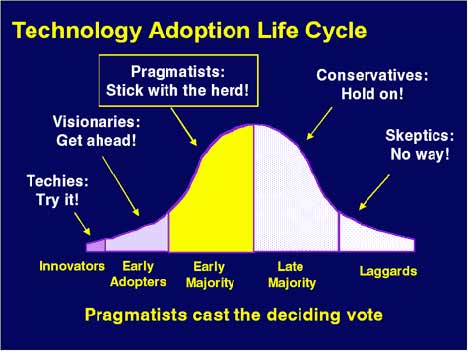
Next time we look at this I’ll bring in Everett Rogers’ innovator theory, published in his book, “Diffusion of Innovations”. Rogers classifies consumer attitudes towards purchasing products into five categories according to how quick consumers are to purchase new products. The results are mapped in a bell curve.
1. innovators (2.5%),
2. opinion leaders or early adapters (13.5%),
3. early majority (34%),
4. late majority (34%), and
5. laggards or late adapters (16%).
The chart is often used to describe the adoption of technologies. The same could be used for adoption of generational philosophy, values and behaviours.
The Bell Curve is also the name of a controversial book published in 1994 by Richard J. Herrnstein and Charles Murray exploring the role of intelligence in understanding social problems in America. The title is a reference to the bell-shaped graph of IQ scores. The book purports to chronicle the rise of a “cognitive elite”, a social stratum of persons with high intelligence and an increasingly high chance of succeeding in life. (From Wikipedia)